January 22, 2024
2023 record marine heat waves: Coral Bleaching HotSpot maps reveal global sea surface temperature extremes, coral mortality, and ocean circulation change
Thomas J. F. Goreau & Raymond L. Hayes
The manuscript is a non-peer reviewed preprint published on EarthArXiv, it will be submitted to the Oxford Open Journal on Climate Change
https://eartharxiv.org/repository/view/6603/
ABSTRACT
2023 was the hottest year in recorded history on land and in the sea, with dramatic and unexpected temperature increases (Cheng et al., 2024, Hausfather, 2024). 2023 Coral Bleaching HotSpot maps provide unique insight into global ocean circulation changes in response to greenhouse gas (GHG) forcing that caused dramatic global temperature rises. The highest excess daily air temperatures recorded in 175 countries, as well the most prolonged excessive sea surface temperatures, were centered around Jamaica. 2023 marked the worst coral bleaching yet in the Northern Hemisphere, with the Southern Hemisphere poised to follow in early 2024. The HotSpot maps strongly suggest accelerated ocean poleward heat transport, slowdown in upwelling, and decreased deep water formation, linked to sharply increased 2023 increased sea and air surface temperatures. The 2023 distribution of severe heat and bleaching follows both spatial patterns and temporal trends first shown from a baseline 1982-2001 global SST trend analysis (Goreau, Hayes, & Mcallister, 2005). Increased warming of both hot and cold ocean currents shows that horizontal mixing of tropical heat to the poles is accelerating, and that vertical mixing with cold deep water is slowing down, leading to increased ocean stratification, which will cause sea surface temperature to increase more rapidly and CO2 mixing with the deep ocean to decrease.
INTRODUCTION: Extreme 2023 high temperatures
2023 was the hottest year in recorded Earth history (Figure 1; see Cheng et al., 2024, Hausfather, 2024). Jamaica had the highest increase of air temperatures out of 175 countries measured in 2023 (Climate Central, 2023). We show here that Jamaica was also in the center of the highest excess sea surface temperatures (SST) in coral reef regions in the world during 2023, which resulted in the worst high temperature reef bleaching and coral mortality ever seen across the entire Caribbean Region since the first event in 1987 (https://www.globalcoral.org/largest-hottest-longest-caribbean-bleaching-corals-dying-from-extreme-heat/; https://www.globalcoral.org/2023-global-coral-reef-alliance-winter-solstice-report-reef-reparations-from-fossil-fuel-producers-for-mass-extinction-of-coral-reefs-from-global-warming/).
Severe bleaching mortality also happened in Kiribati, Fiji, and Papua New Guinea, and other places. As 2024 starts, the El Niño that began in mid 2023 will affect the southern hemisphere. During the first weeks of 2024 New Guinea, Solomon Islands, and the Great Barrier Reef reached bleaching threshold temperatures, and are expected to rise as the El Niño intensifies during the Southern Hemisphere Summer bleaching season, and may also affect Tuvalu, Vanuatu, Fiji, Samoa, and Tonga.
When asked if direct measurements show if global ocean circulation is changing, the traditional answers of physical oceanographers are that satellite sensors only measure the surface skin millimeters thick, not what happens deeper inside the water. The present oceanographic data base is insufficiently dense in space and time, so will take several decades to tell, but that could happen sooner with vastly increased expenditure on oceanographic instrumentation, including remotely operated robot drones.
Here we examine the spatial patterns and temporal trends of excessive SST Coral Bleaching HotSpot heat waves during 2023 in light of their long-term changes in order to gain insight into changes in general ocean circulation and heat transport not easily shown by other methods.
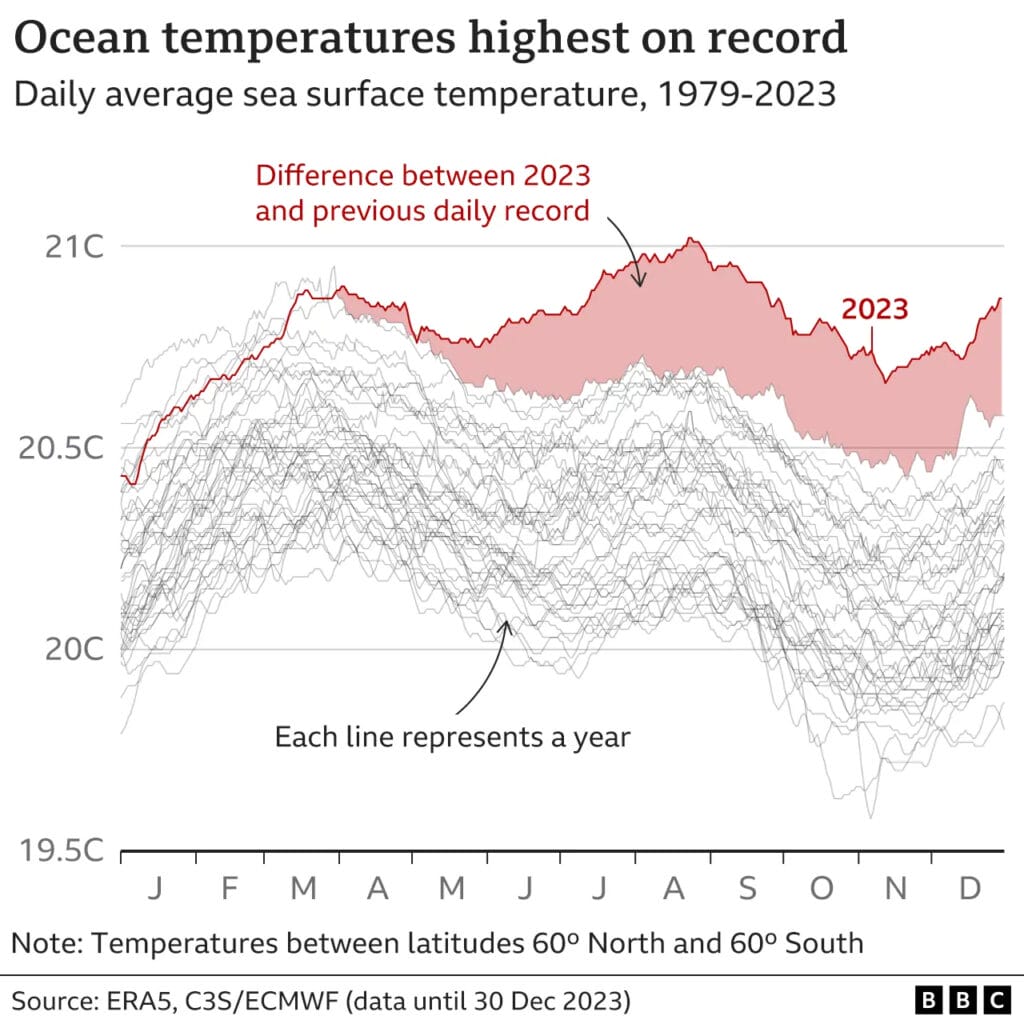
Figure 1. Global sea surface temperatures since 1979 show 2023 represents a quantum jump. 2023 confirmed as world’s hottest year on record (BBC, 2024),
Results: 2023 Coral Bleaching HotSpot spatial patterns
Below are the 2023 global patterns of maximum Coral Bleaching HotSpot values (Figure 2) and their durations (Figure 3). We have defined HotSpots as surface waters with excess temperature more than one degree C above the average temperature of the warmest month at that site (Goreau, 1990; Goreau, 1991), as a predictor of Coral Bleaching (Hayes & Goreau, 1991; Goreau et al., 1993; Goreau et al. 1994; Goreau & Hayes 1994, 2021, Goreau et al., 2000). The Coral Bleaching HotSpot is also a general indicator of extreme heat waves in all parts of the surface ocean, with biological stress proportional to the product of excess temperature times its duration. HotSpot intensity and duration (degree heating weeks above the temperature threshold, DHW) allows mapping the areas that are warming most rapidly and identifying changes in ocean current heat transport.
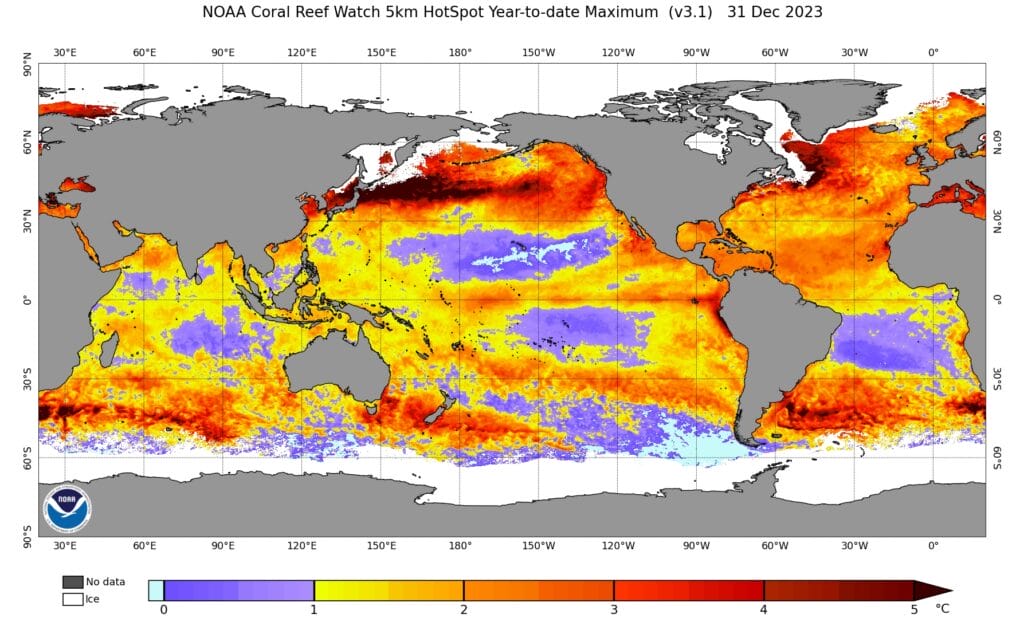
Figure 2. 2023 Maximum Coral Bleaching HotSpot
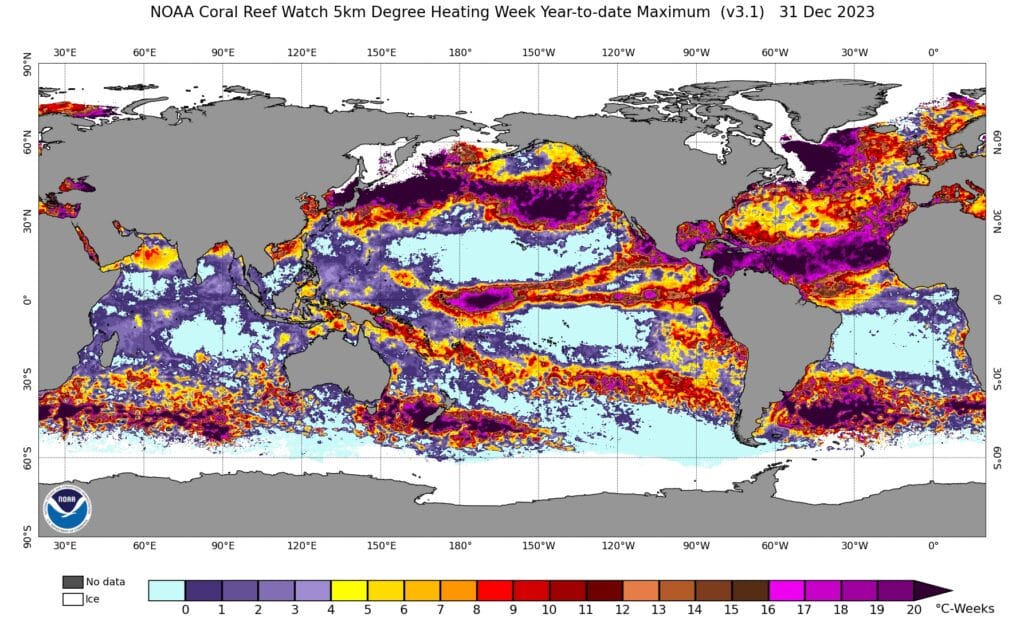
Figure 3. 2023 Maximum coral bleaching degree heating weeks
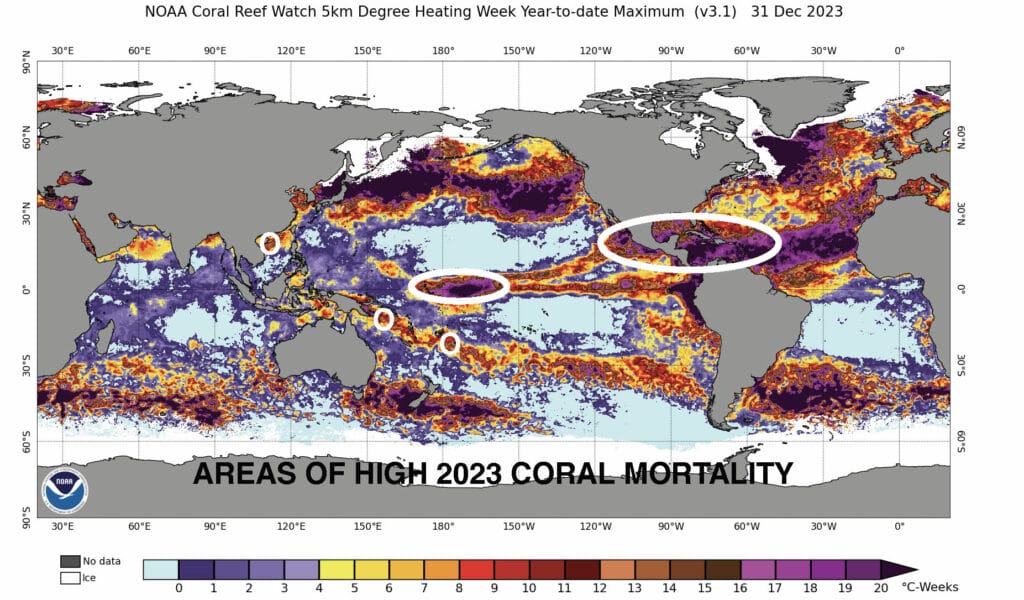
Figure 4. Areas of high bleaching and mortality in 2023.
Areas of high 2023 coral bleaching mortality, shown in white circles and ovals (Fig. 4), represent coral reefs that underwent high cumulative heat stress. These included the entire Caribbean region, the east and west coasts of Mexico and Central America, Kiribati, Fiji, Eastern New Guinea, which are reported by local observers to have near total bleaching and severe coral mortality (and probably Hainan, China, which could not be confirmed). More places were affected than were reported, but most tourism dive operations no longer report bleaching because it is “bad for business”. Comprehensive mapping of bleaching is impossible because sport dive shops won’t report it and no international scientific bleaching monitoring network has ever been established in developing countries, despite urgent pleas from Caribbean coral scientists after the first high temperature bleaching events in the 1980s (Williams, Goenaga, and Vicente, 1987; Goreau, 1990, Hayes and Goreau, 1991, Glynn 1992).
Results: Caribbean bleaching
The entire Caribbean region, both islands and continental coasts, was affected by severe excess temperature (Fig. 5), with the longest duration of abnormal heating in the Haiti-Jamaica-Nicaragua-Honduras-Costa Rica area (Fig. 6), along with the west coasts of Mexico and Central America. Severe bleaching began in Florida and moved steadily southward across the region, ending in the southern Caribbean. The authors have seen every bleaching event in the Caribbean, and the mortality is the worst yet seen in the Caribbean region, even though each time there are fewer living corals left to bleach (Hayes & Goreau, 2008). Coral fragmentation nurseries costing millions of dollars are reported to have lost all their corals, but have remained silent on their losses, perhaps in the hope of attracting future funding with promises of a different result. At time of writing, it is still too soon to know how many bleached corals will recover or will die from heat stroke stress. Some are regaining their color, but others will fail to recover, or will be killed by diseases, pollution, algae overgrowth, or grazing by snails and polychaete bristleworms. Even though some corals may regain their colors, they will stop depositing their skeleton for around a year (Goreau & Macfarlane, 1990).
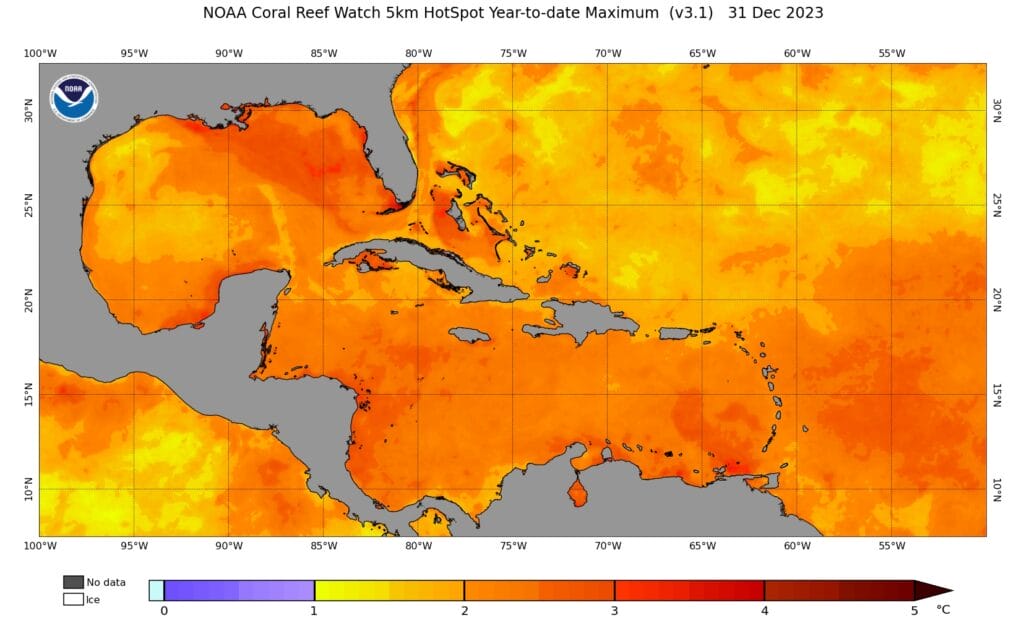
Figure 5. 2023 Caribbean Maximum HotSpot excess temperature levels.
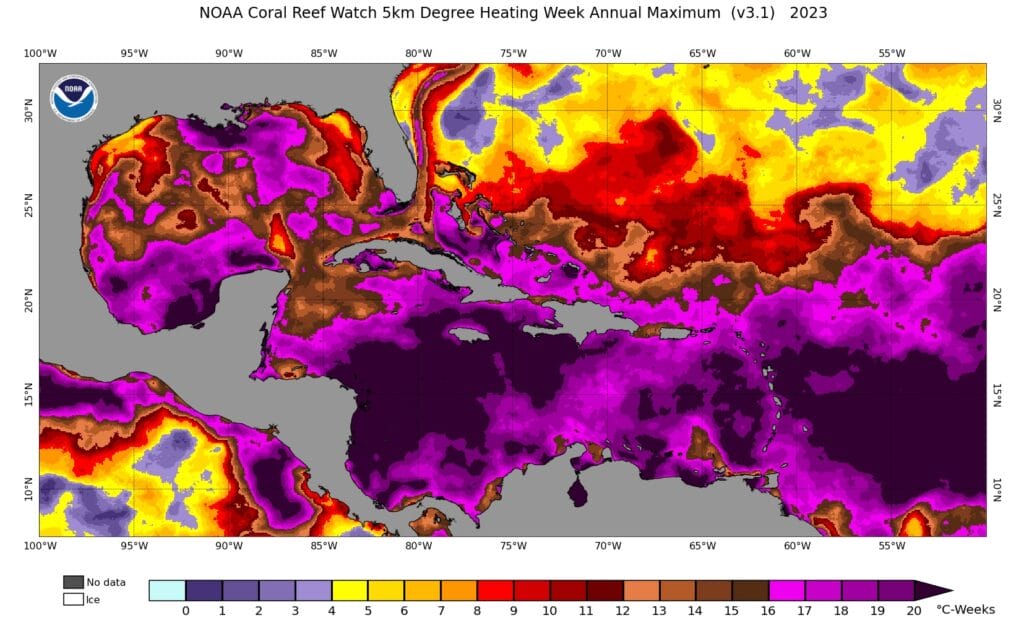
Figure 6. 2023 Caribbean Maximum DHW map, the product of excess temperature and duration. The entire region was severely affected by coral bleaching, with the longest duration of excessively high temperatures around Jamaica, stretching to Nicaragua in the west and Haiti in the east.
Results: Comparison of 2023 pattern with long-term ocean warming and ocean circulation trends
Satellite sea surface temperatures (SST) are based on infrared emission from the top millimeters of the sea surface. Changes in sea surface temperature result from changes in 1) heat transport from the atmosphere due to changing winds and waves, 2) horizontal transport in surface ocean currents, and 3) vertical transport due to mixing of surface and deep water. Although SST measurements provide instantaneous images only of two-dimensional surface heat distribution, regional changes in SST can provide insight into changes into global heat circulation patterns. In the case of possible changes in vertical heat exchange, they provide unique insights that cannot be obtained from subsurface oceanographic measurements (Figure 7), which are too sparse in time and space to adequately document large-scale or long-term changes.
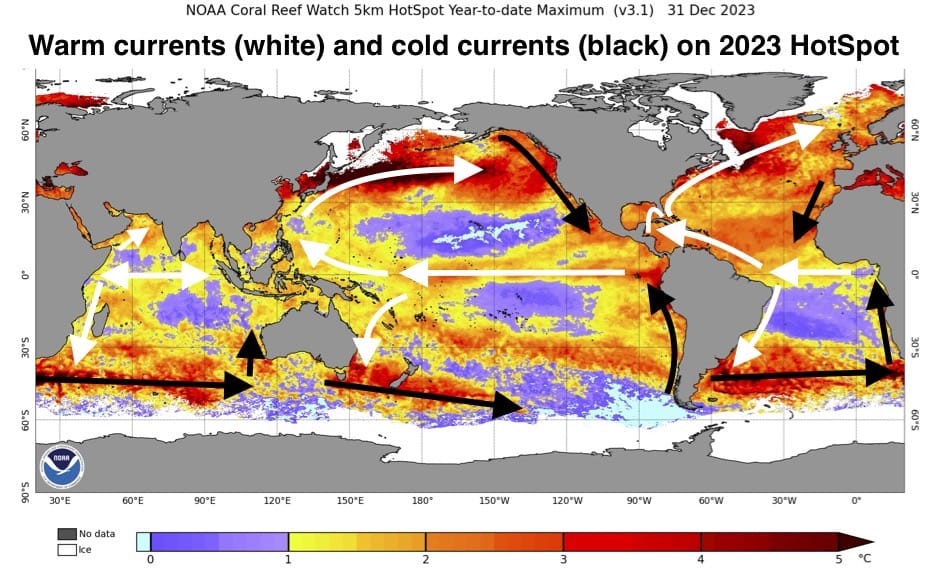
Figure 7. The major warm currents are shown as white arrows and cold currents as black arrows. All major surface currents and upwelling zones are warming up more rapidly than average, showing strong HotSpots during 2023.
All major warm currents show extreme warming during 2023, suggesting that heat transport from the tropics to the polar regions has accelerated, causing the most extreme HotSpots of all to be in the axis of the Kuro Shio and Gulf Stream currents. Increasing equatorial to polar heat transport is keeping the tropics relatively cool, making the heating greatest in sub polar oceans, acting as a positive feedback that accelerates polar ice melting, albedo feedbacks, and increasing ocean stratification, all major global warming feedbacks that have been underestimated and are inadequately modelled in IPCC climate change projections (Taylor et al., 2023).
All major cold currents also show extreme warming during 2023, suggesting strongly that heat transport in the cold current regions is slowing down, causing decreased upwelling and vertical mixing, and increasing stratification.
The large-scale global patterns seen in all warm and cold currents almost perfectly match the spatial pattern of trends in global sea surface temperatures between 1983 and 2001 (Figure 8, from Goreau, Hayes, & Mcallister, 2005). 2023 marks a strong continuation of the spatial patterns in global warming noted since the start of the NOAA Satellite SST database. The main areas warming more slowly than average are seen to be largely confined to the interiors of the large ocean basins, the deserts of the oceans, which are downwelling gyres, and the regions of most intense upwelling, waves, and currents in the South East Pacific portion of the Circum-Antarctic Current. These major spatial patterns and temporal trends have been surprisingly stable over the last four decades. The main exception seen in 2023 is in the diagonal band of very hot water southeast from Fiji to Chile, an area that has been anomalously warm for a few years. 2023 therefore does not mark an anomaly but is the continuation of a trend that is at least 4 decades old, the entire period during which global satellite-measured sea surface temperature data have been collected.
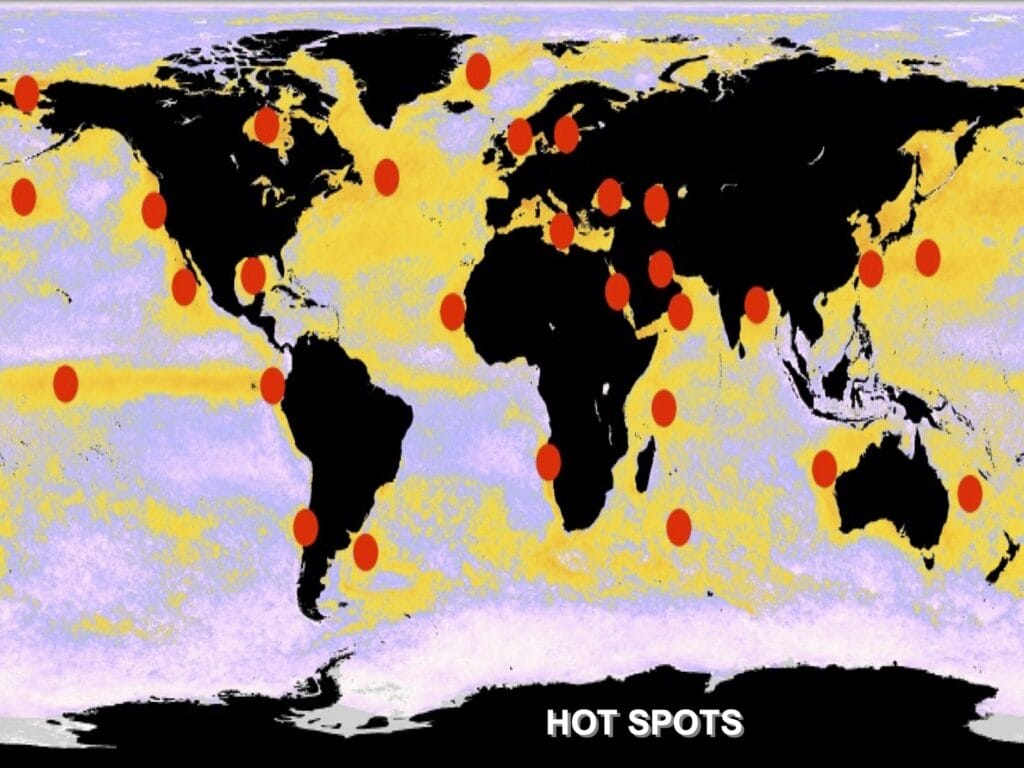
Figure 8. Average rate of NOAA Satellite Sea Surface Temperature warming, 1983-2001, with long-term hot spots (red dots), from Goreau, Hayes, and Mcallister, 2005. Note higher than average warming (yellow) in all hot and cold ocean currents, and lowest rate of warming (pale) in the mid ocean gyres and around Antarctica. The 2023 Hot Spot anomaly continues and intensifies these trends, which have now continued for over the last 40 years.
Conclusions: Large scale ocean circulation change is underway
Coral Bleaching HotSpot data from 2023 implies significant changes in global ocean circulation and climate change outside of tropical coral reef regions, especially in flow of heat from the equator to the poles. This is not easily determined from oceanographic data, and changing ocean circulation is not considered in IPCC model projections.
Due to failure in the 1980s to set up coral bleaching monitoring in the developing countries where almost all coral reefs are found, there are almost no data available to estimate coral bleaching mortality or economic impacts by comparing before and after monitoring, except for a handful of very rich and unrepresentative countries. This is a classical example of environmental insensitivity and inequity, because those who most need the information have been systematically denied funding to develop it. Most local coral health monitoring programs in developing countries collapsed during the Covid epidemic.
Coral Bleaching Satellite Sea Surface Temperature HotSpot analysis in the record hot year 2023 explains the global distribution of coral bleaching, and reveals dramatic increases in heat transport by the Gulf Stream and Kuro Shio, increasing ocean vertical stratification while decreasing atmosphere horizontal equator to pole gradients. This tends to weaken the global Hadley Atmospheric Circulation of heat via atmospheric winds from equator to poles, and makes the Jet Stream more variable, leading to increased weather variability and extreme climatic fluctuations.
Decreased vertical exchange in cold surface currents and upwelling zones increases thermal stratification and slows down the Atlantic Meridional Overturning Circulation (AMOC), retains heat remain longer in the surface ocean, and reduces CO2 exchange among the atmosphere, surface ocean, and the deep sea. The Hot Spot maps from year to year suggest that upwelling systems can abruptly shut off, causing sudden sharp rises in regional air temperatures, and reducing air-ocean exchange of temperature and CO2. Decreased upwelling is causing bottom-up collapse of fisheries in all world’s most important upwelling zones, while overfishing is simultaneously causing their top-down collapse.
REFERENCES
Cheng, L., Abraham, J., Trenberth, K. E., Boyer, T., Mann, M. E., Zhu, J., Wang, F., Yu, F., Locarnini, R., Fasullo, J., Zheng, F., Li, Y., Zhang, B., Wan, L., Chen, X., Wang, D., Feng, L., Song, X., Liu, Y., Reseghetti, F., Simoncelli, S., Gouretski, V., Chen, G., Mishonov, A., Reagan, J., Von Schuckmann, K., Pan, Y., Tan, Z., Zhu, Y., Wei, W., Li, G., Ren, Q., Cao, L., & Lu, Y., 2024, New Record Ocean Temperatures and Related Climate Indicators in 2023, Adv. Atmos. Sci., https://doi.org/10.1007/s00376-024-3378-5
Climate Central, 2023, The hottest 12-month stretch in recorded history: How carbon pollution affected countries and major cities from November 2022 to October 2023, https://www.climatecentral.org/report/the-hottest-12-month-stretch-in-recorded-history-2023
Glynn, P.W., 1991. Coral reef bleaching in the 1980s and possible connections with global warming. Trends in Ecology & Evolution, 6(6), pp.175-179.
Glynn, P.W., 1996. Coral reef bleaching: facts, hypotheses and implications. Global change biology, 2(6), pp.495-509.
T.J. Goreau, 1990, Coral bleaching in Jamaica, NATURE, 343: 417
T.J. Goreau, 1991, Testimony to the National Ocean Policy Study Subcommittee of the United States Senate Committee on Commerce, Science, and Transportation, S. HRG. 101-1138: 30-37, US Government Printing Office, Washington DC
T.J. Goreau, R. L. Hayes, J. W. Clark, D. J. Basta, & C. N. Robertson, 1993, Elevated sea surface temperatures correlate with Caribbean coral reef bleaching, p. 225-255 in R. A. Geyer (Ed.), A GLOBAL WARMING FORUM: SCIENTIFIC, ECONOMIC, AND LEGAL OVERVIEW, CRC Press, Boca Raton, Florida
T.J. Goreau, & R. L. Hayes, 1994, Coral bleaching and ocean “hot spots”, AMBIO, 23: 176-180
T.Goreau, T. McClanahan, R. Hayes, & A. Strong, 2000, Conservation of coral reefs after the 1998 global bleaching event, Conservation Biology, 14: 5-15
T.J.F. Goreau & R. L. Hayes, 2021, Global warming triggers coral reef bleaching tipping point, Ambio, https:doi.org/10.1007/s13280-021-01512-2
T.J. Goreau & R. L. Hayes, 2005, Monitoring and calibrating sea surface temperature anomalies with satellite and in-situ data to study effects of weather extremes and climate changes on coral reefs, WORLD RESOURCE REVIEW, 17: 242-252
T.J. Goreau, & R.L. Hayes, 2005, Global coral reef bleaching and sea surface temperature trends from satellite-derived Hotspot analysis, WORLD RESOURCE REVIEW, 17: 254-293
T.J. Goreau R.L. Hayes, & D. McAllister, 2005, Regional patterns of sea surface temperature rise: implications for global ocean circulation change and the future of coral reefs and fisheries, WORLD RESOURCE REVIEW, 17: 350-374
T.J. Goreau & A. H. Macfarlane, 1990, Reduced growth rate of Montastrea annularis following the 1987-1988 coral bleaching event, Coral Reefs, 8: 211-215
Hausfather, Z., 2024, State of the Climate: 2023 smashes records for surface temperature and ocean heat, Carbon Brief: https://www.carbonbrief.org/state-of-the-climate-2023-smashes-records-for-surface-temperature-and-ocean-heat/
R.L. Hayes & T. J. Goreau, 1991, The tropical coral reef ecosystem as a harbinger of global warming, Proc 2nd International conference on global warming, World Resources Review, 3: 306-322
R.L. Hayes, & T. J. Goreau, 2008, An analysis of satellite-derived sea surface temperatures from Caribbean and Atlantic reef sites, 1982-2003, REVISTA BIOLOGIA TROPICAL, 56: 97-118
G.M. Taylor, P. Wadhams, D. Visioni, T. Goreau, L. Fields, & H. Kusawanto, 2023, Bad science and good intentions prevent effective climate action, Arxiv, https://eartharxiv.org/repository/view/6244/, https://doi.org/10.31223/X5DT25
Williams Jr, E.H., Goenaga, C. and Vicente, V., 1987. Mass bleachings on Atlantic coral reefs. Science, 238(4829), pp.877-878
Williams Jr, E.H. and Bunkley-Williams, L., 1990. The world-wide coral reef bleaching cycle and related sources of coral mortality. Atoll Research Bulletin.
Trackbacks/Pingbacks